Getting Started with Wireshark
Executive Summary
I had never used Wireshark in earnest before today. Here are some notes for the next time I have to use it.
Details
Create a launcher that lets you run multiple Wireshark windows at the same time.
Use Automator with the run shell script action to execute this command:
open -n /Applications/Wireshark.app
Put this in the dock. Bonus points for using the Cmd-i copy/paste icon trick.
Configure some useful columns
This five minute YouTube video shows some tips for initial setup of Wireshark.
Make sure you set it up to capture HTTP2
From this blog post:
    gRPC is based on HTTP/2. So we have to analyze packages to solve some
    difficult problems related to the protocol. This wiki introduces how
    to do this using Wireshark because capturing packages of HTTP/2 is a
    little different with HTTP/TCP.
Download Wireshark of recent versions.
       Add your port to HTTP protocols:
           Open Preferences
           Select Protocols>HTTP. HTTP2 works too, but HTTP is enough
           Add your HTTP/2 port like(50051) to TCP ports
           Click OK to save the config
       Select(Double click) your network interfaces like Loopback: lo0(local)
       Input http2 in the filter
       Run your gRPC applications
       Stop(Capture>Stop). Then you can analyze the packages or save to a file for using later.
How does it work in general?
When you start Wireshark, it asks you to select which network
interface(s) from which to capture packets. If you’re doing localhost
stuff, just doubleclick Loopback: lo0. It will start showing data.
You can quickly type some text in the “Apply a display filter …” text
area at the top to constrain what sort of information is shown. For
example, type http, http2 or grpc and press enter. From this
point on, only traffic related to those protocols is shown. The filter
language is incredibly rich and powerful.
Using Wireshark to debug gRPC traffic
My current project involves gRPC. My mentor Ryan Lubke shared the follomwing tip when using Wireshark to inspect gRPC traffic, distilled here as an ordered list.
-
Start Wireshark using the launcher above
-
Double click
Loopback: lo0. -
Type
grpcinto the..using this filtertext area and press enter. -
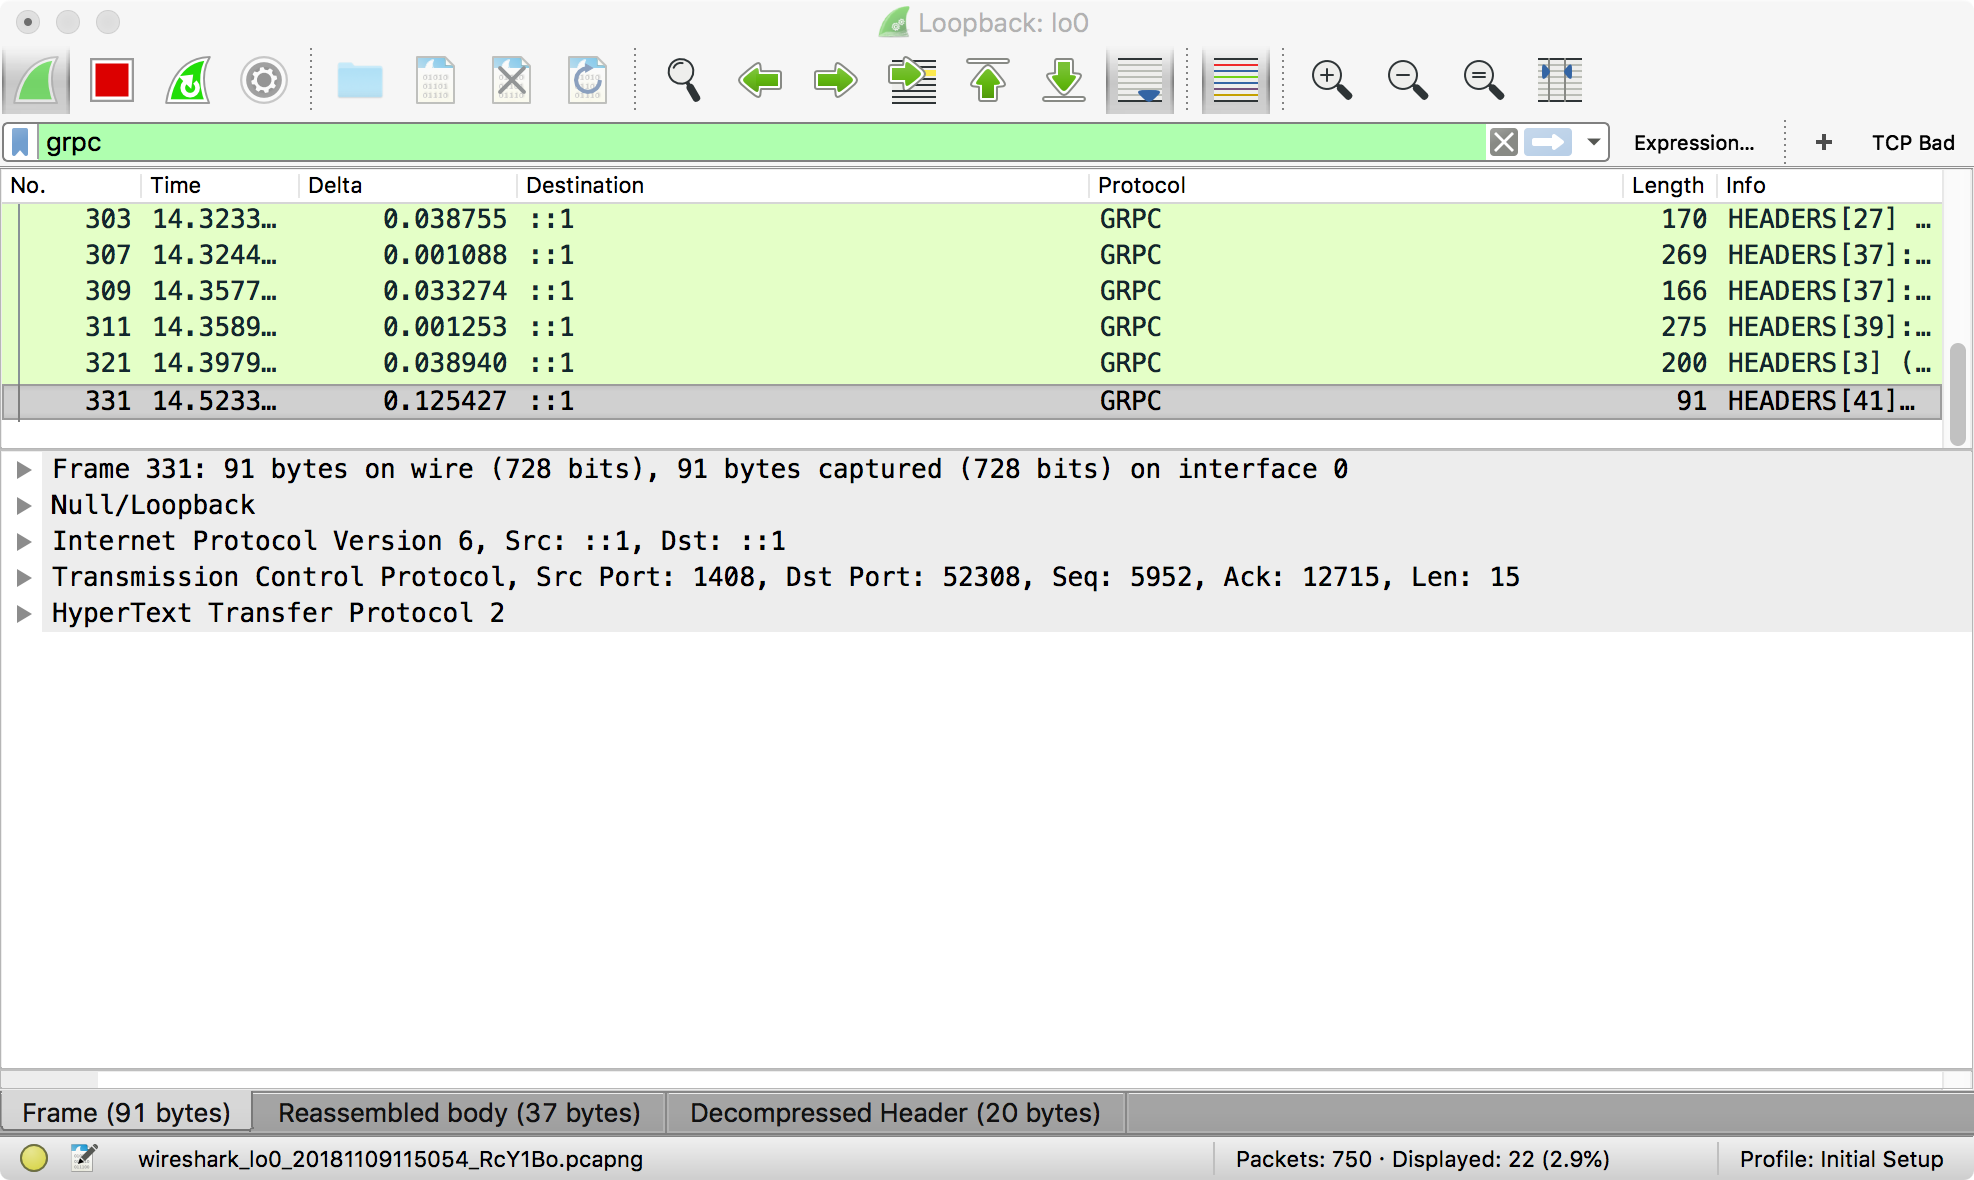
Start your gRPC traffic generation. The window should look like the following. Every row in the top pane is a packet of traffic that passes the filter above.
 Note that the title of the window is
 Loopback: lo0. Each Wireshark session listens on one network interface. -
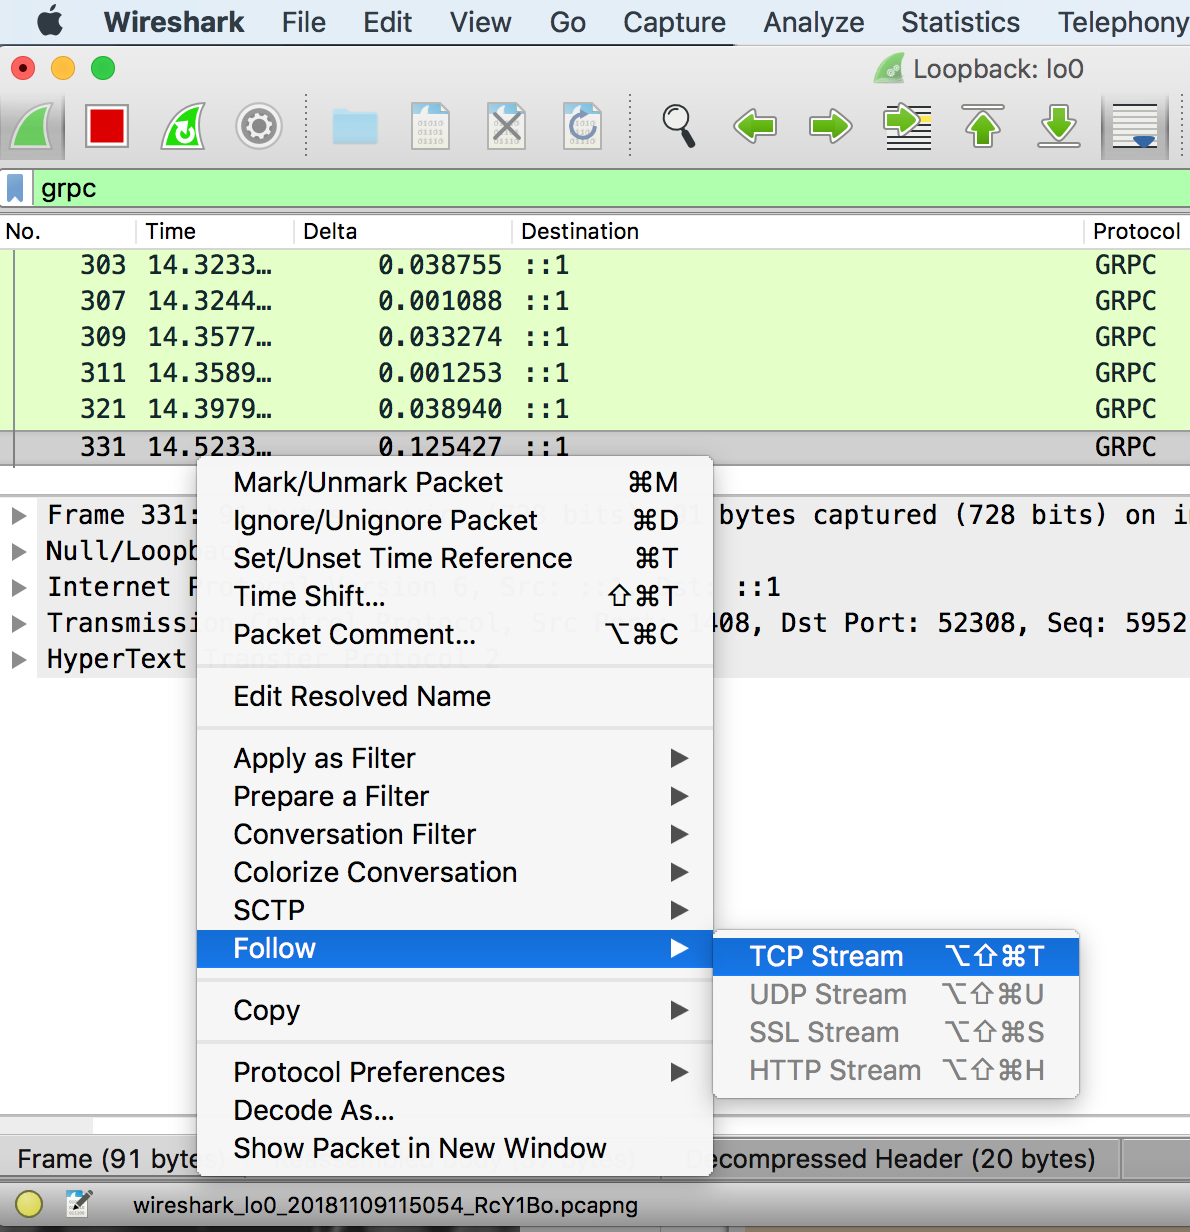
To see the actual gRPC traffic, right click one packet (row) in the top pane, and choose
Follow > TCP Stream.
-
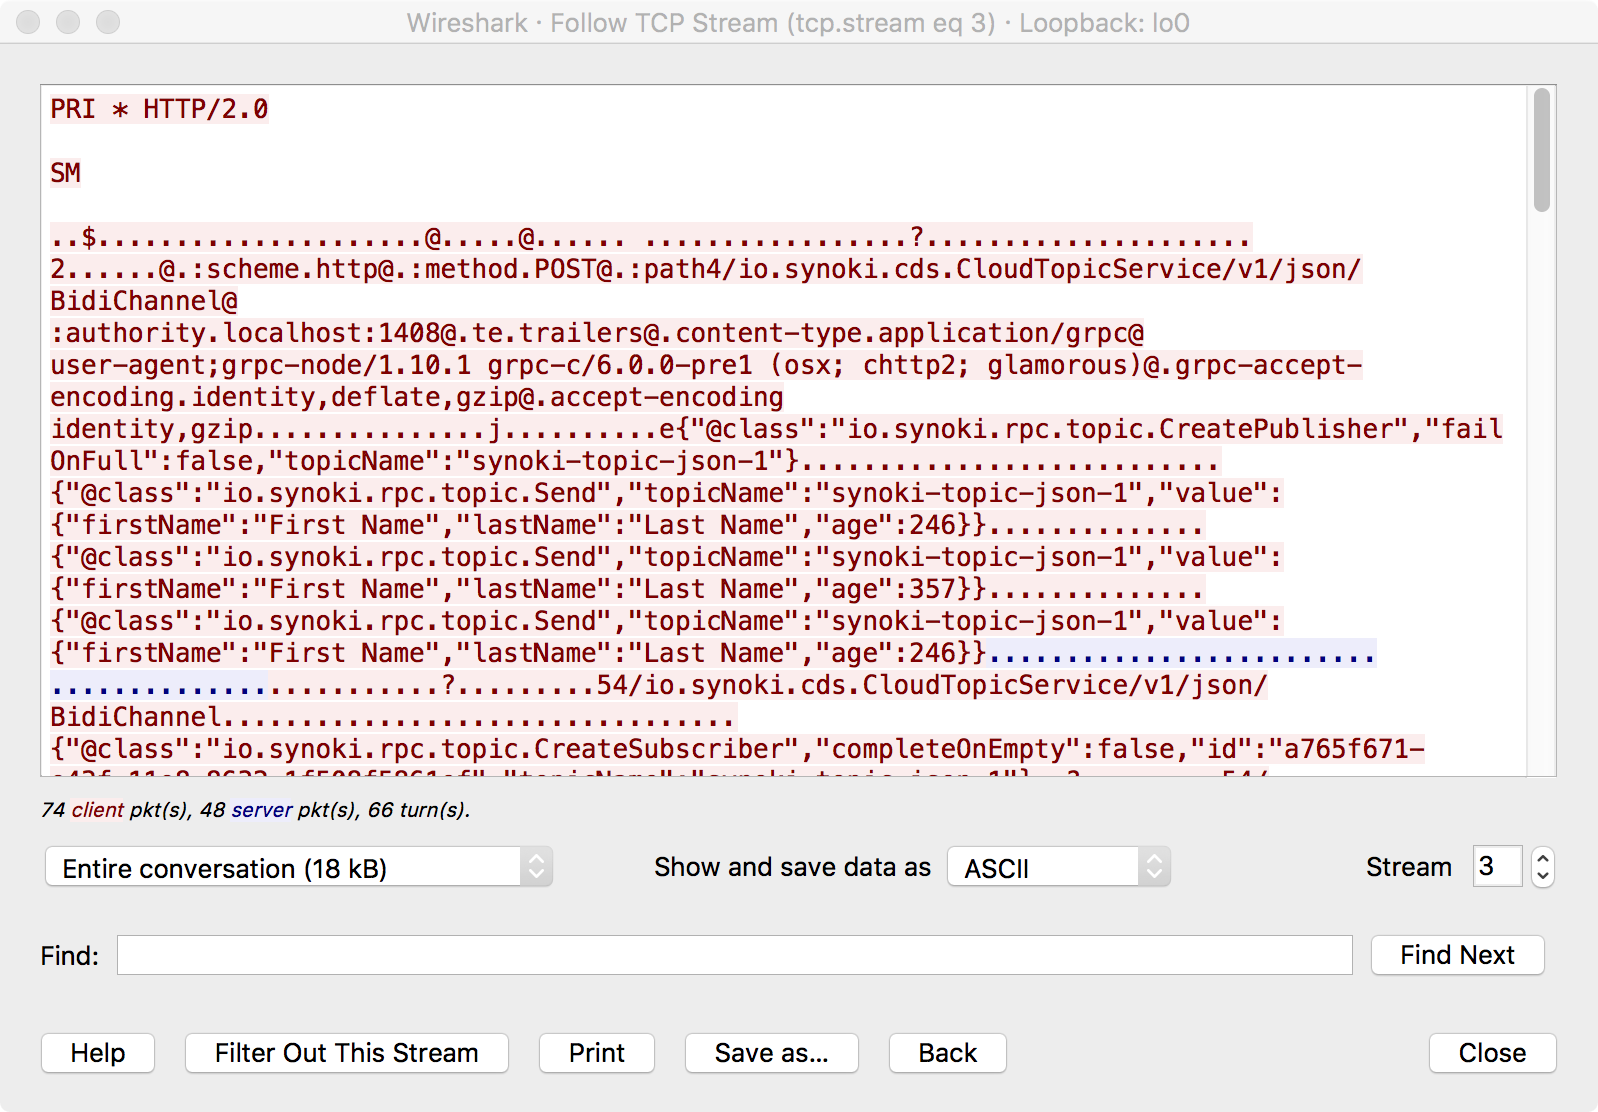
The actual HTTP/2 traffic sent over gRPC is shown here:
 The text search feature is extremely useful.
Wireshark is an incredibly powerful tool. It’s worth your time to learn it well.